 Tickets now on sale for The SaaS CTO Conference, Thursday 12 September, London UK
Please note that this post, first published over a year ago, may now be out of date.
Benchmarking half a million containers so you don’t have to
This article is from 2021, so the data are right for then, but aren’t current. Notably, AWS Fargate now offers Graviton AArch64 CPUs as well as the AMD64 instruction set.
But why?
I’m a big fan of Fargate. It’s simple, feature rich and works incredibly well. So I was a bit surprised to hear a claim on a public Slack community, that Fargate performance would likely compare unfavourably with regular EC2, because that’s where the old m3.* era hardware ends up. If this had been found on Wikipedia, it would quickly have been tagged as “Citation Needed”. Fargate has never felt sluggish to me, in fact, quite the opposite. So with a bunch of AWS credits to burn, I set about running some benchmarks to get some real data.
Test setup
My aim here was to collect a large sample of data from containers running on ECS Fargate, to find out what the underlying CPUs are and how they perform. It turned out to be ridiculously easy to do.
First, I crafted a container that would startup, query the underlying CPUs abilities using the lscpu tool, and then run a series of benchmarks using the sysbench tool. The results were then uploaded to an S3 bucket for later analysis.
Wanting to run lots of containers, this had to be automated, but it didn’t need to be bullet proof. After a bit of testing, the general process went like this:
- Iterate randomly through every region enabled on my account (17 at the time of writing).
- For each region, create a default VPC, an ECS cluster and a task definition pointing at the container. This was required as I use the excellent
aws-nuketool to routinely empty my accounts. - Issue a
RunTaskAPI call using the CLI to start a task running with the specific parameters of that specific test run.
Start to finish, that process takes less than 10 seconds. It’s quite frankly amazing when you think about it.
Test runs
Over the course of a couple of weeks I performed several runs:
- 391 tasks performing 30 second CPU tests.
- 418737 tasks performing 30 second CPU tests.
- 43080 tasks performing 900 second CPU tests.
- 55203 tasks performing 30 second CPU tests on Fargate Spot.
Making a total of 517412 benchmark runs.
Each run also included memory tests run over 10 seconds and disk performance benchmarks. In this article, I’m not going to cover Fargate storage - the story might have changed after AWS announced new storage options for Fargate containers, allowing the local ephemeral storage to be increased from the default 20GiB.
The first set of tasks were used to validate the scripting, and successfully resulted in all 391 started tasks reporting back their benchmark data to S3. Longer CPU tests were added to test how consistent the performance was over a longer period. The reason I started a set of Fargate Spot tasks was to see if these tasks get different CPUs to on-demand. They don’t, so there’s no further analysis on those.
Benchmarks
sysbench is a benchmarking tool specifically written to be lightweight and scriptable. I used the built-in cpu and memory benchmarks. The CPU benchmark applies either a single threaded or multi threaded maximum load on the CPU, the benchmark score is reported in events per second. The memory benchmark writes to memory and reports back in MiB per second written. For comparison purposes, my local Ryzen 3600 based machine scored a single CPU score of 2073.73, a multi CPU score of 13051.76 and a memory score of 9413.
Now to the data.
What CPUs power Fargate?
It depends. It varies based on region and the size of the task requested. If we take a global view across the entire population, then these are the CPUs used. The percentage column shows the number of tasks that ran on that particular CPU across all runs.
| Model | Speed | Count | Percentage |
|---|---|---|---|
| Intel(R) Xeon(R) Platinum 8259CL | 2.50GHz | 162905 | 31.48 |
| Intel(R) Xeon(R) E5-2686 v4 | 2.30GHz | 153583 | 29.68 |
| Intel(R) Xeon(R) Platinum 8175M | 2.50GHz | 119211 | 23.04 |
| Intel(R) Xeon(R) Platinum 8124M | 3.00GHz | 29600 | 5.72 |
| Intel(R) Xeon(R) E5-2676 v3 | 2.40GHz | 21093 | 4.08 |
| Intel(R) Xeon(R) E5-2666 v3 | 2.90GHz | 17683 | 3.42 |
| Intel(R) Xeon(R) Platinum 8275CL | 3.00GHz | 11915 | 2.30 |
| Intel(R) Xeon(R) E5-2670 v2 | 2.50GHz | 1081 | 0.21 |
| Intel(R) Xeon(R) E5-2680 v2 | 2.80GHz | 341 | 0.07 |
It’s immediately obvious that AWS is only using Intel Xeon CPUs, with no sign of any AMD Epyc anywhere. Rather less surprising, is that Fargate doesn’t offer any of their own Graviton2 processors on Fargate yet. These ARM based chips already offer much better performance at the same price points, when compared to the traditional x86_64 options on EC2, and for managed services such as RDS and Elasticsearch. I expect we’ll see them appear as an option fairly soon.
The vast majority of tasks will be run on only three different models of CPUs. Let’s see how each of the models used performs. First let’s look at the single CPU benchmark scores. The data here is limited to tasks with at least 1 CPU, but as you’ll see later, the scaling is linear at lower CPU levels.
(Click on the charts for larger versions)
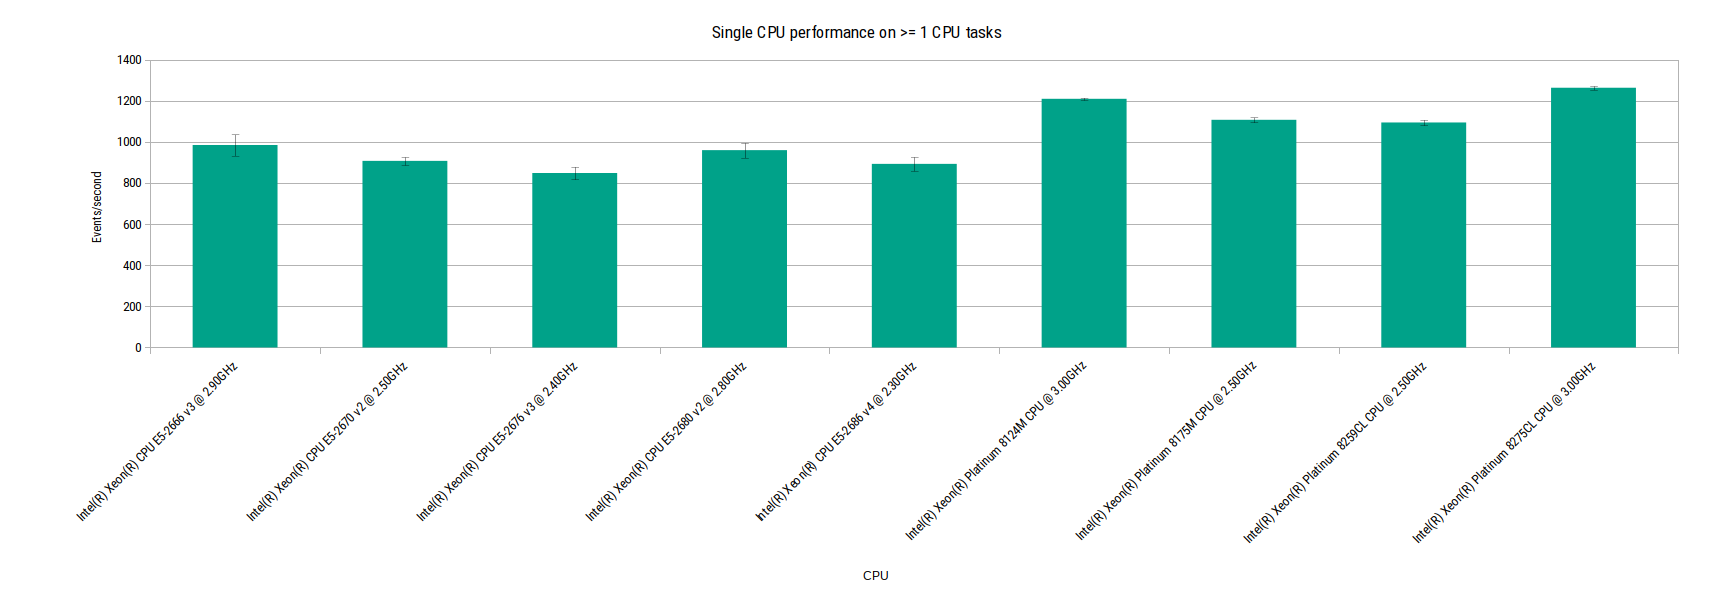
Single CPU performance on >=1 CPU tasks
There’s not a huge difference between any of the CPUs when looking at the CPU benchmark here. The consistency of the performance is noteworthy, the variation within CPU models is tiny as shown by the small error bars. But it’s a completely different story when we look at the memory performance.
First let’s look at all the different task sizes under test and the memory benchmark scores for each.
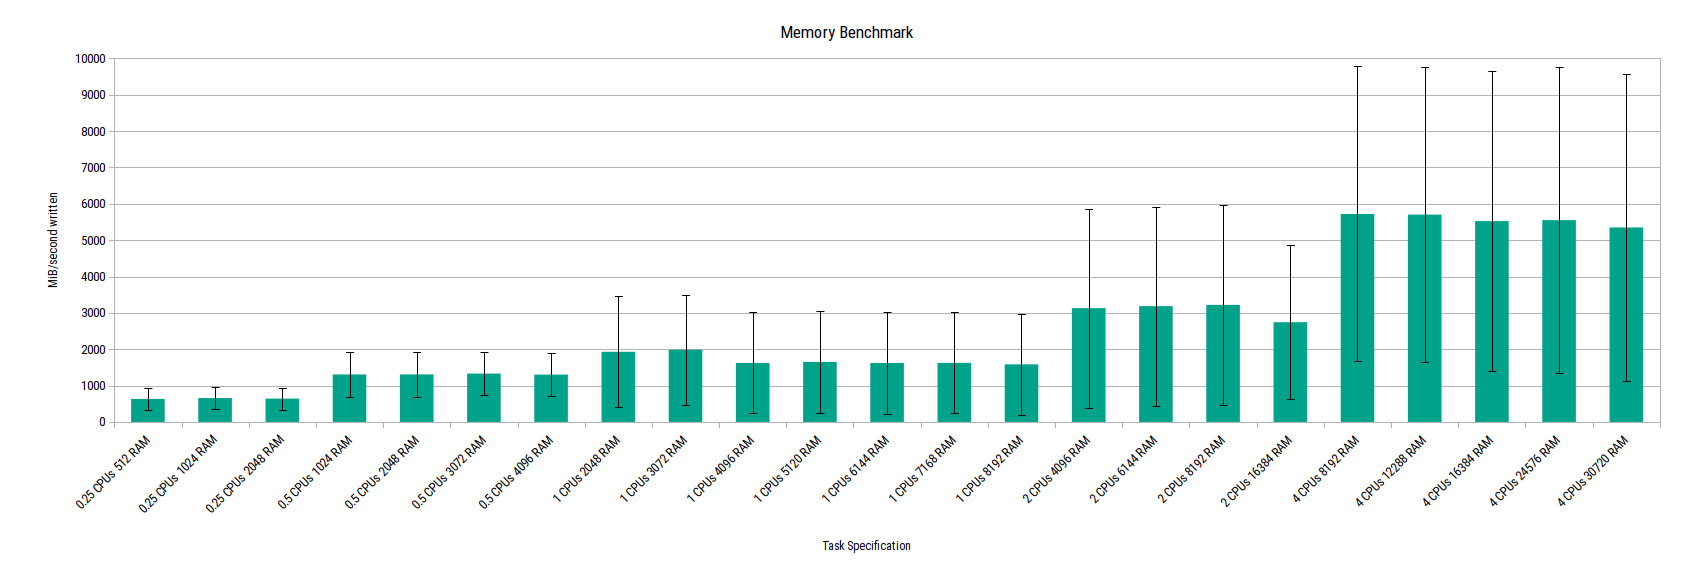
Memory benchmark
The error bars in this chart show that there’s huge variation around the mean result for each task size. Simply speaking, this means that the memory performance varies massively. Let’s have a look at the memory benchmark for each CPU model to see what’s going on. Tasks with 4 CPUs were used here to get a wider range of memory size samples included.
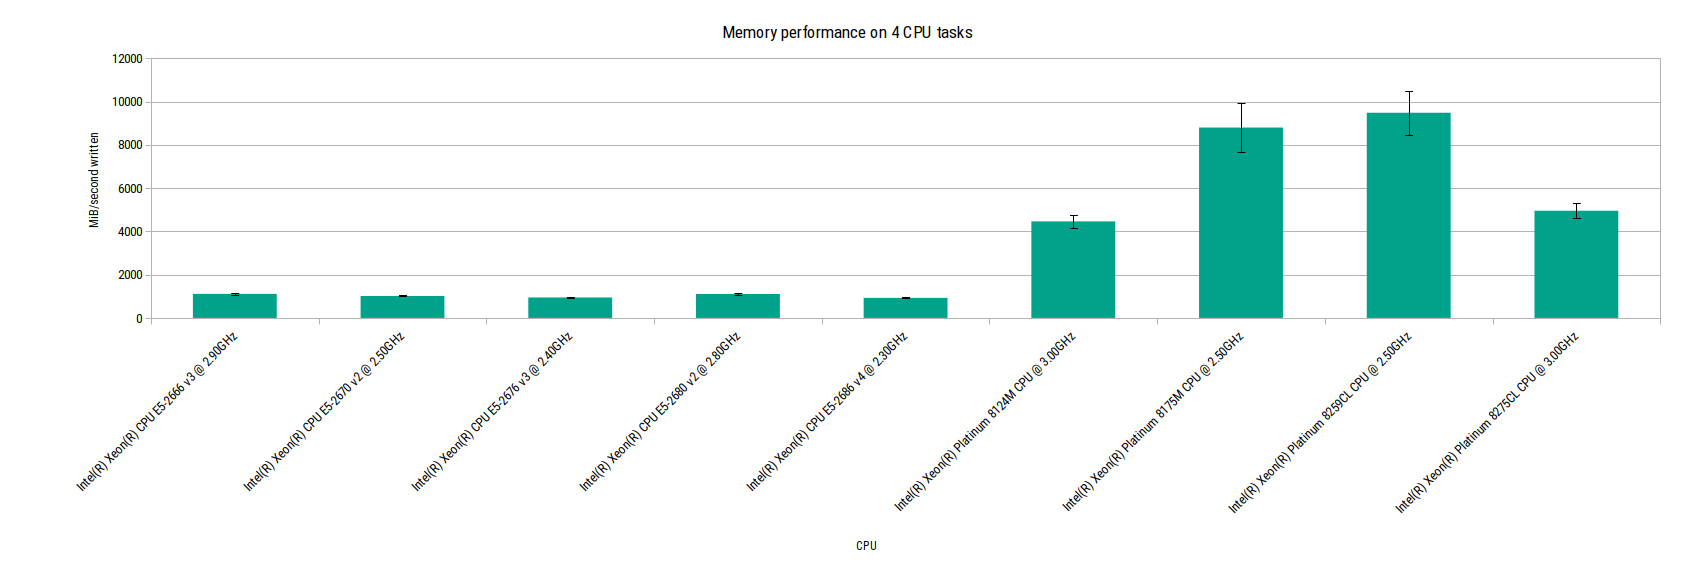
Memory performance on 4 CPU tasks
This paints a much clearer picture. For all the older generation CPUs (everything that predates the Xeon Platinum models), memory performance is pretty poor. For all the newer Platinum CPUs, performance is much, much better. The error bars for each CPU model also show that there is little variation from the mean performance within each model.
Is this relevant? Probably not, unless your workload is bound by the memory performance, which is unlikely for most but not all workloads on Fargate. The CPU performance is far more relevant to the majority of people, so let’s add that to the chart.
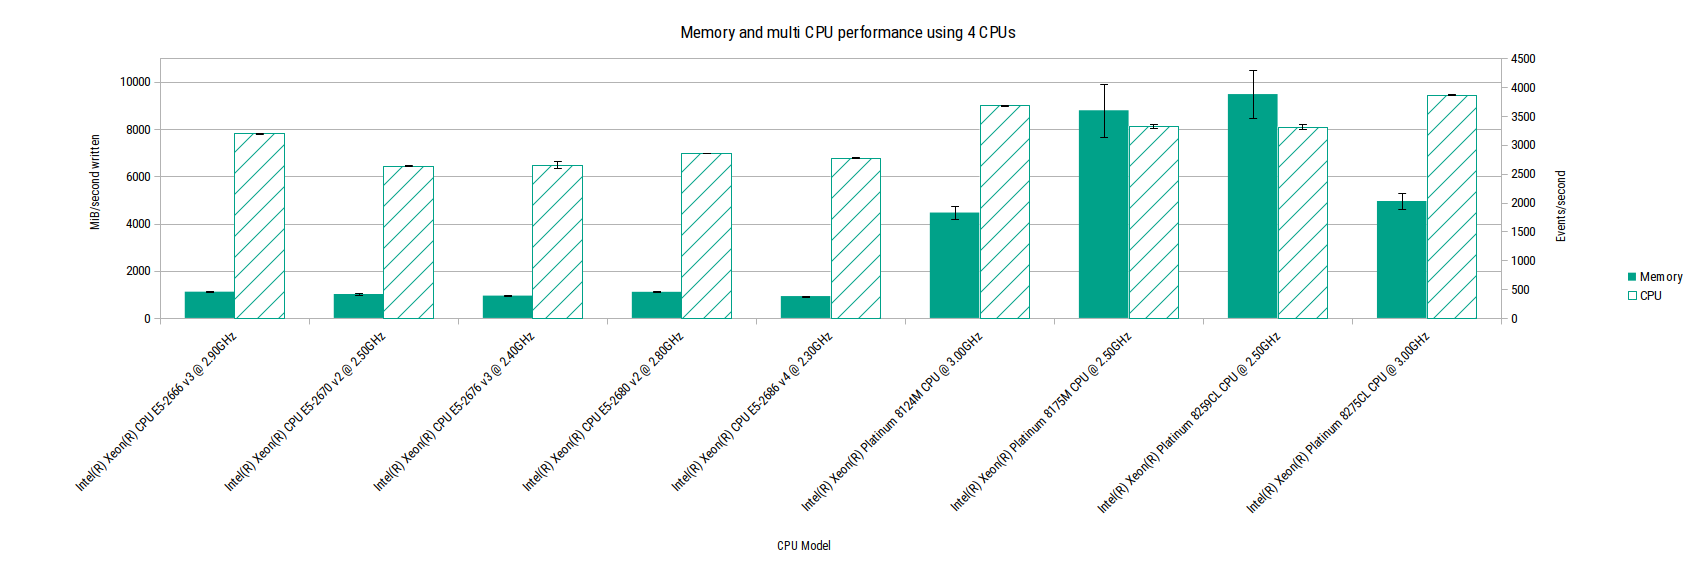
Memory and CPU performance on 4 CPU tasks
This shows that CPU performance is relatively consistent across all the generations, even when looking at those CPUs with very poor memory performance.
Speaking of CPU performance, let’s have a look at CPU performance across all the task sizes tested.
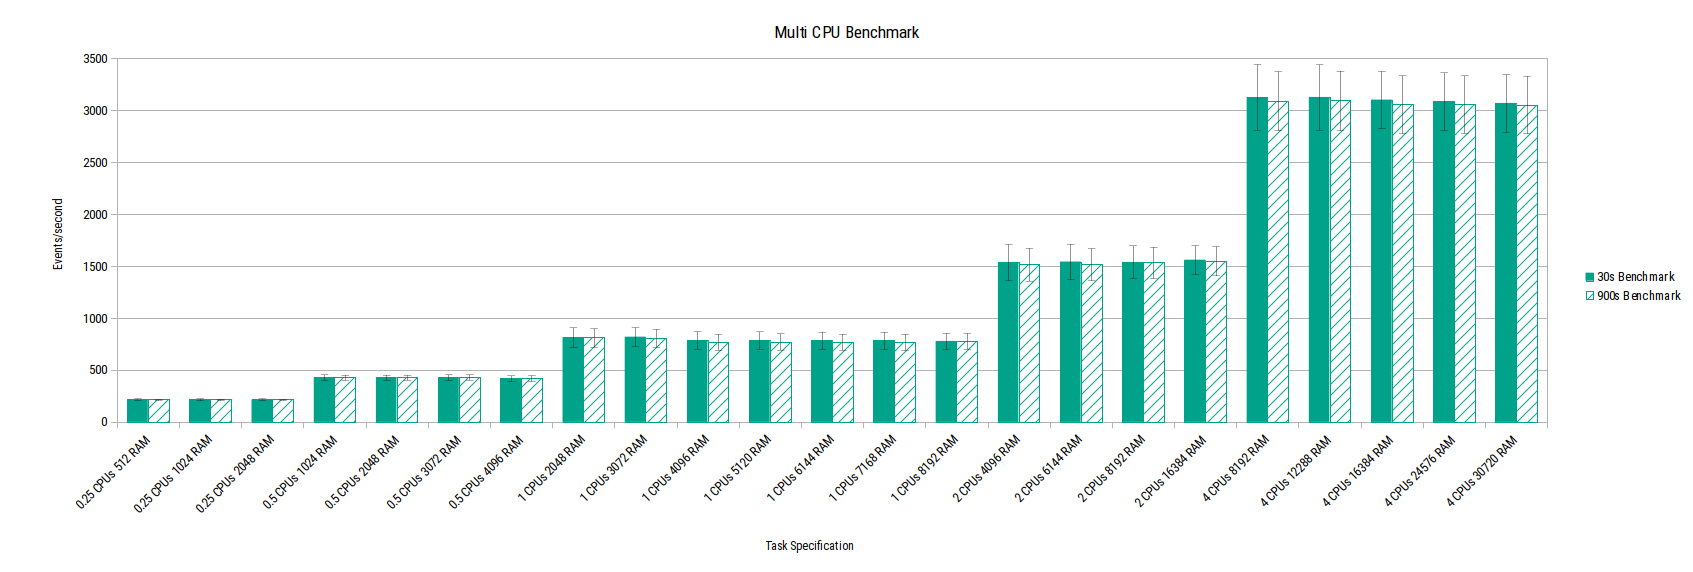
Multi CPU performance
This chart shows that performance scales linearly with the number of CPUs allocated to the task. The variation within each task size is also small over both the quick 30-second benchmark and the longer 900-second benchmark.
Next, let’s look at CPU performance by region. Note that the y-axis starts at 700.
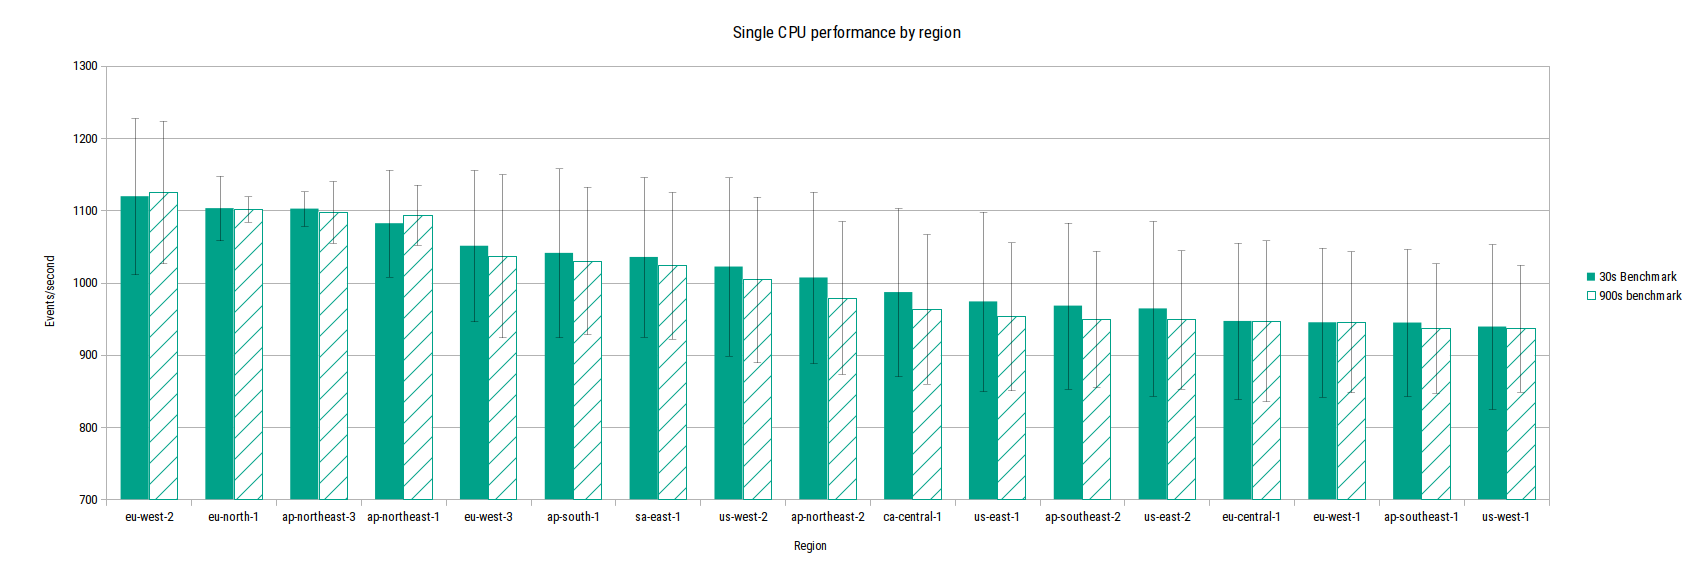
Single CPU performance by region
This shows that there is a small difference in performance between regions, with ’newer’ regions benefiting from more recent underlying CPUs.
Going further, the data also shows that ’newer’ zones have much newer CPUs and higher performance as a result. The following chart shows the relative difference in performance between the fastest and slowest zones for each region.
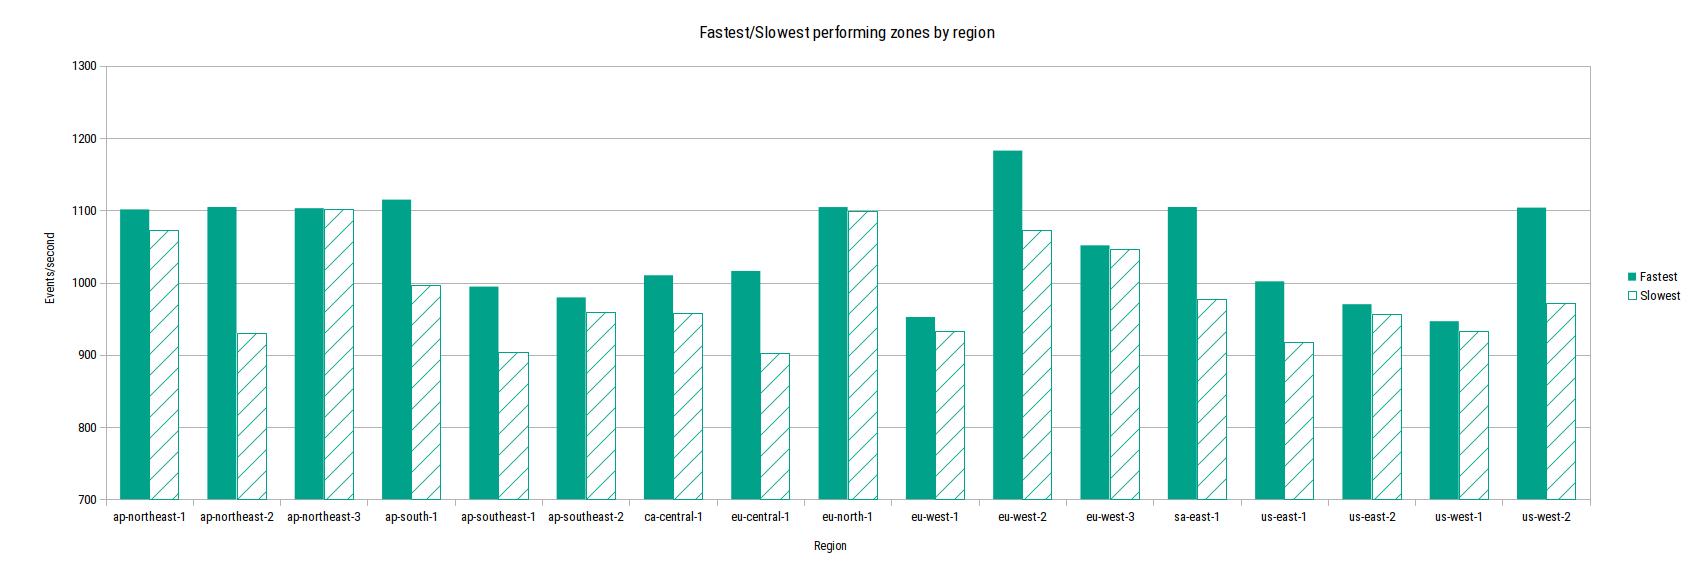
Fastest/Slowest zones by region
It also shows that some regions have large differences between the fastest and slowest zones, such as ap-northeast-2. While others, like ap-northeast-3 have no noticeable difference.
I want the best (CPU|memory) performance.
It’s interesting (to me at least!) that there’s no single CPU that offers the best CPU and memory performance, so it will always be a trade off.
For the best outright CPU performance, the Xeon Platinum 8275CL @ 3.00GHz has the lead here. But the memory performance on that CPU is about half that of the other CPUs. It’s still more than 3 times faster than the memory on the older generation CPUs though.
For the best memory performance the Xeon Platinum 8259CL @ 2.50GHz has a small lead. The trade off is slower outright CPU performance, when compared to the CPU above and the Xeon Platinum 8124M @ 3.00GHz.
How do I get it? I want SPEED.
Officially, you don’t.
Part and parcel of the ECS Fargate service is that you don’t get to choose the underlying compute provided to your tasks, everything is managed for you. You shouldn’t need to know what CPU your task is running on. Having said that, if you have a specific workload that demands the highest performing CPU or memory speeds, is it still possible?
Yes. Sort of.
Although privileged containers are not permitted on Fargate, it’s entirely possible to query the underlying CPU that’s powering a task.
That’s precisely how this data was collected. Using the same mechanism and ECS services, you can instrument your container startup to query the CPU currently in use, and validate that the CPU is in your ‘allowed’ list. If you’ve managed to get a dud less desirable CPU, then simply trigger a shutdown of the task and ECS will automatically spin up another task.
As this could result in tasks constantly spinning waiting for the ‘right’ CPU to use, I would highly recommend adding some state, using something simple like AWS Parameter Store to keep track of how many attempts have been made by the service. After n attempts, stick with whatever CPU is provided.
For regions with newer zones and therefore newer CPUs, you can explicitly target those zones by limiting the subnets you provide to your ECS service or RunTask API calls.
Or just use ECS/EC2 and pick your instance type…
I want to do this! How much did it cost?
Cool. The more data the better! Hopefully this post has provided enough information to get you going, but if not please get in touch.
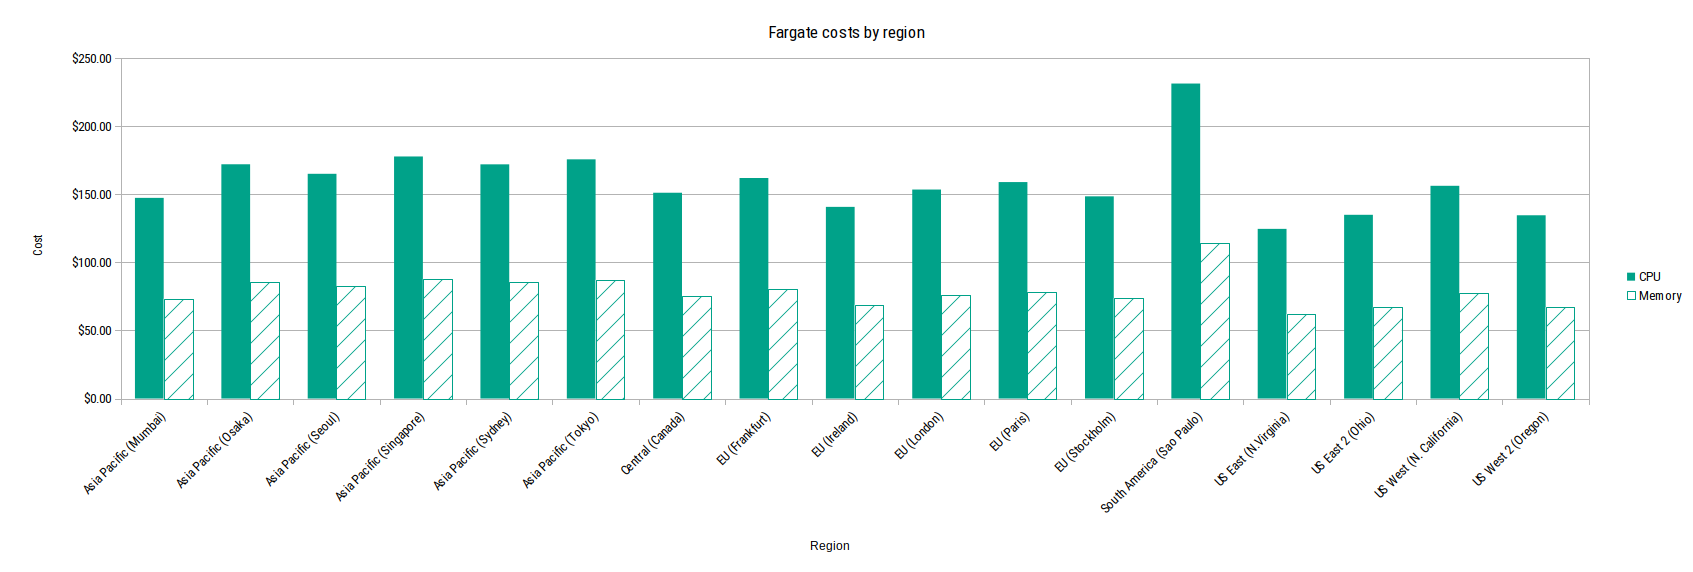
Cost wise, running half a million containers worked out at $4136.83 in ECS charges, along with a few cents for S3 and data transfer. Really cheap when you consider the amount of first class engineering that goes into the various components that make up ECS Fargate. The best bit is that all that work is done for you. It’s amazingly good value.
At this scale, ECS cost differences between regions start to become noticeable, as shown in the chart below. So if you’re running infrastructure at a large scale, it’s worth spending some time upfront looking at which region works out best for your use case.
Want an easier route to running your workload in containers, with security, build automation, and scalability designed in? We offer a number of packaged container platforms that provide exactly that.
This blog is written exclusively by The Scale Factory team. We do not accept external contributions.